Hi,
Greetings from the DistrictD Team.
Now that FY26 earnings have drawn to a close, we take stocks of our Model's baseline estimates. Just like every year, we did an analysis on the deviations in Revenue/EBITDA/EPS between FY26 actual numbers and our base model estimates. The analysis was performed on 1,312 companies this time, for companies which have March Year-end.
The key takeaways are:
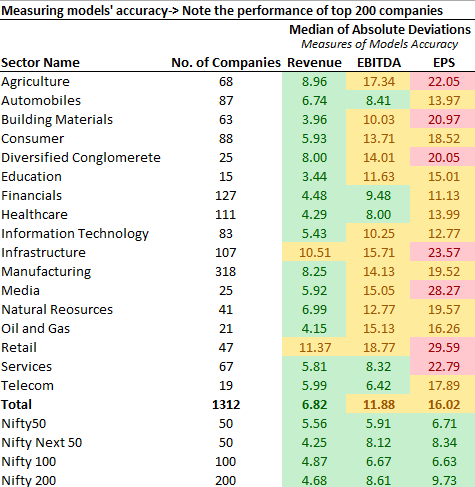
The Median of absolute "Revenue, EBITDA and EPS deviations" across 1,312 models stood at 6.82%, 11.88% and 16.02% respectively, marking a distinct improvement over our previous cycles. For Nifty 200, i.e. top 200 constituents these numbers are even lower at 4.68%/8.61%/9.73% indicating that our numbers were broadly inline.
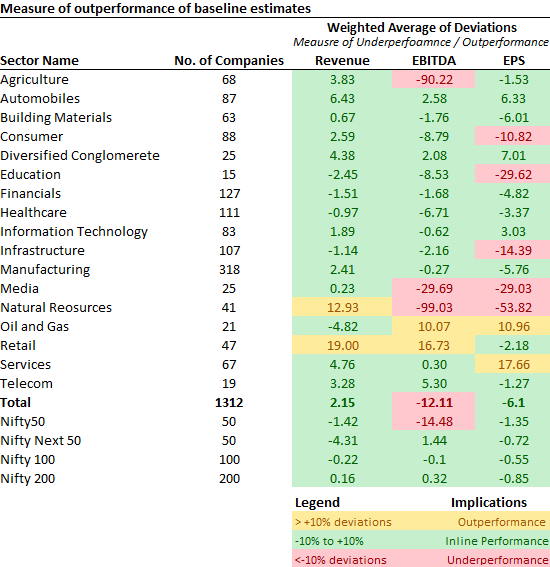
The conservative bias that we had in our estimates in the previous few cycles was noticeably lower this time. Our team focused on maintaining the estimates broadly inline with the company's actual performance trend through the quarters.
Accurate areas – Financials, IT, Building Materials and Healthcare. Our models for several large cap companies such as HDFC Bank, SBI Bank, ICICI Prudential AMC, Pidilite Industries, Indus Tower Ltd, Torrent Pharmaceuticals, Dr. Reddy Lab, Axis Bank, ICICI Bank, HUL etc. had less than 5% deviation across Revenue/EBITDA/EPS.
Inaccurate areas - Our model numbers were off in Retail, Agriculture, Natural Resources and Oil & Gas. Companies where our models were off significantly were Bharat Dynamics., Aditya Birla Fashion and Retail Ltd., MTNL, PI Industries, JSW Cement, BSE Ltd etc.
At overall topline level - Out of total 17 sectors, our models were broadly inline in 15 sectors including IT services, Financials, Automobiles, Manufacturing, Consumer, Healthcare, Agriculture, Oil & Gas etc. While for Infrastructure and Retail, we were marginally behind actuals.
We measure the quality of our models on a few parameters mainly being:
The deviation that a base model has with the actual reported number at the end of the year on Revenue and EBITDA. We aim to keep this value within a range of +/- 10%.
The models should as much as possible reflect a true operational model of the company.
Do note that our models are typically updated at the start of the year and are basically to help investors project their own views of the companies they are looking at. Do let me know if you would like to have a closer look at the data. Below are the results: -
Related Blogs

FINANCIAL MODELS AND THEIR NUANCES (PART 1)
Financial models are tools used by analysts to est....
Udit Garg
13/01/2017 12:00 AM

FINANCIAL MODELS AND THEIR NUANCES (PART 2)
Continuing from our previous post on Financial mod....
Udit Garg
13/01/2017 12:00 AM