Another results season and another set of broker downgrades of Nifty EPS have gone by. I thought the downgrades came a month too late. The markets had already fallen, and the downgrades were only a post-facto reporting of what had already happened.
To most informed investors it would not have been any news. Even now I think just following the headlines maybe misleading. For one, while at aggregate level PAT growth maybe missing, the revenues for most players have actually been good, so in some sense it is the margins that have taken a hit and not core growth. Secondly, as is usually the case, there is significant divergence in performances of individual companies – Most commodity companies have benefited from better prices, yet Vedanta’s performance has been weak. Reliance has seen nearly 50%!!! revenue growth (y/y) and telcos have been hurt.
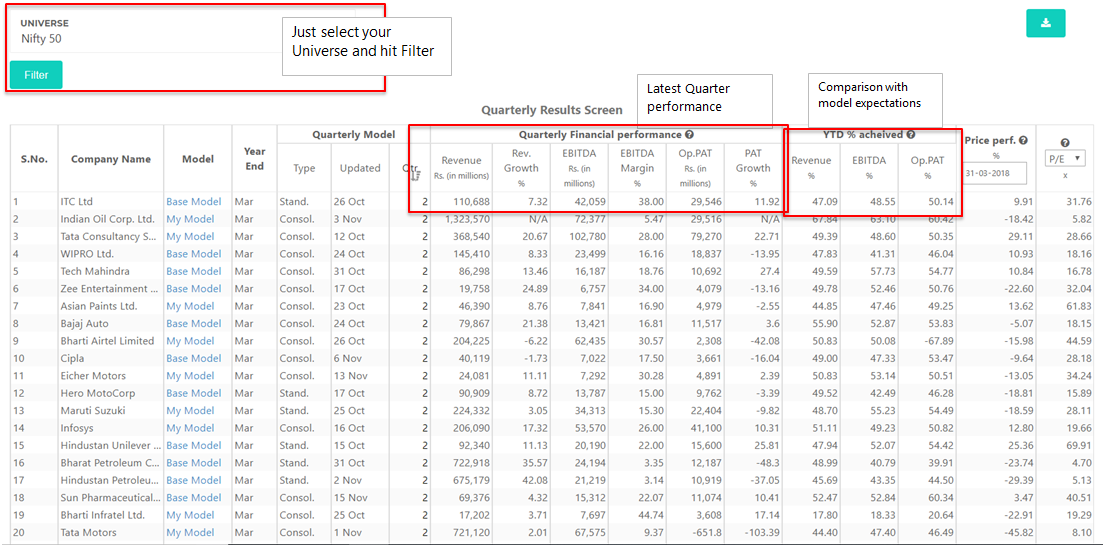
So how do you process the results that matter and all the noise which is generated. Our Quarterly Results Screen could be of your help. It compiles all the results as they are coming and allows one to assess how they are performing on an absolute/relative basis and with respect to full year expectations. Should you like any of these companies, the model for it is a click away, adjust the model accordingly to get a sense of what the real valuations for that company are. A brief screenshot of the quarterly screen
Besides the screening functionalities that we are building, a few other minor updates –
- From a usability point of view we have introduced the My Lists feature that allows you create a new list or pick from existing indexes and assign them to various features such as notifications, calendar, screens etc.
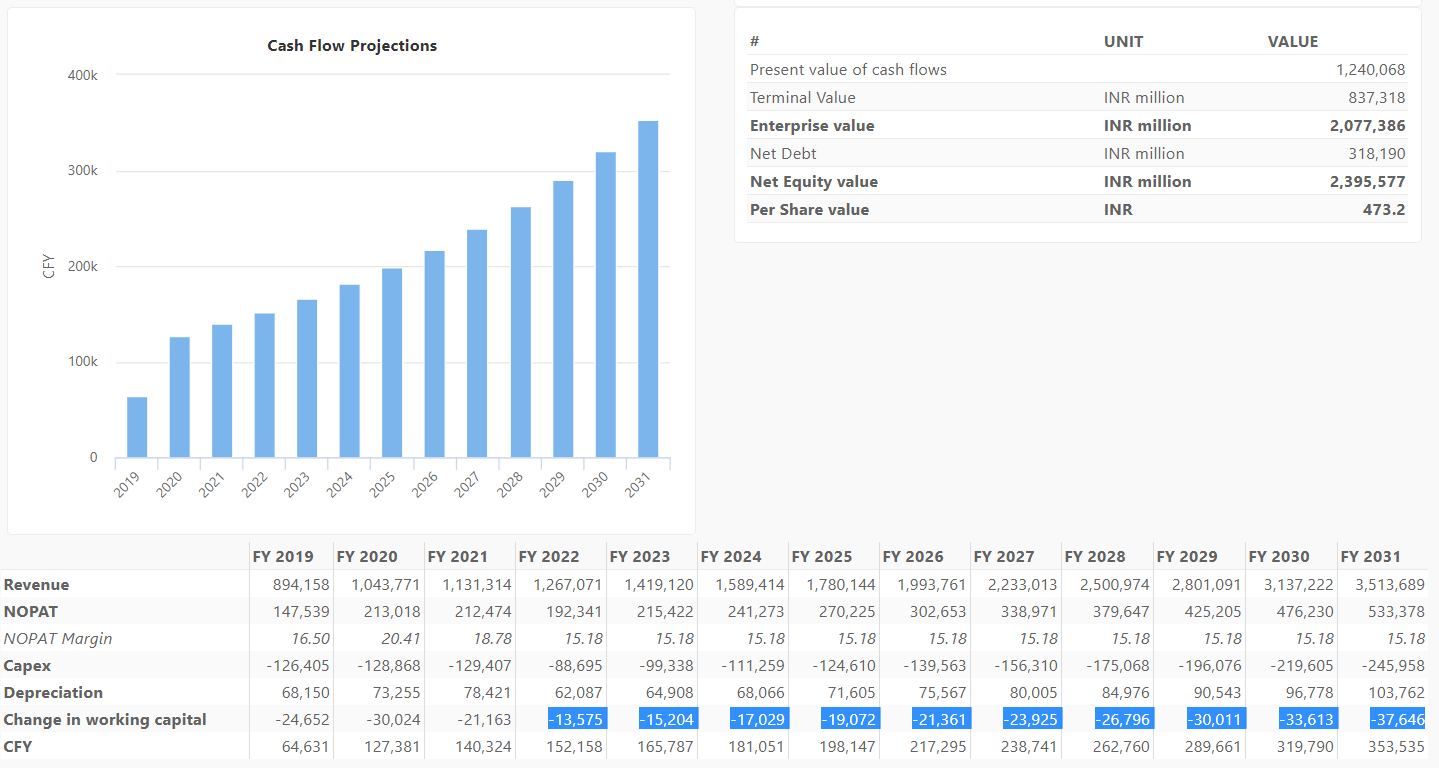
- We had been getting requests to show the detailed numbers of the DCF calculations. Pls see the detailed DCF calculations below that shows up for every DCF.
- Upcoming corporate actions, including dividends, splits/bonuses etc, AGMs etc now show up in your calendar for companies you are following.
Based on the feedback from some of our users, we are currently improving the amount of data captured in our banks and NBFCs models to include fairly detailed ALM analysis and their Assets book breakup, besides the liabilities breakup (already there). We are also in the process of allowing users to do Excess Returns (or EVA) based valuations for Financials companies.
Related Blogs
THE TECHIE FUND MANAGER!
Indian equity markets have grown at a rapid pace o....
Udit Garg
12/03/2017 12:00 AM

It Is The Commodities We Need To Worry About
I have been thinking a lot about this – if as an e....
Udit Garg
26/10/2018 12:00 AM