Hi,
Greetings from the DistrictD Team.
Now that FY24 earnings have drawn to a close, we take stock of our model's baseline estimates. Just like every year, we did an analysis on the deviations in Revenue/EBITDA/EPS between FY24 actual numbers and our base model estimates. The analysis was performed on 1026 companies this time, for companies which have March Year-end.
The key takeaways are:
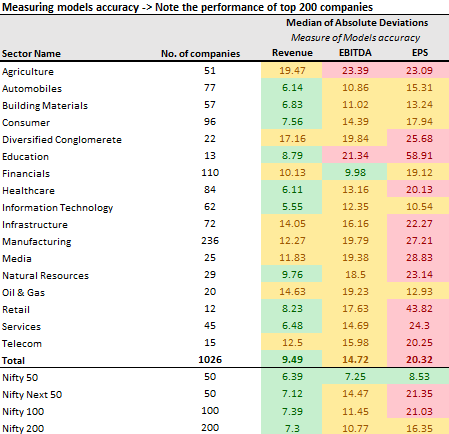
- The Median of absolute "Revenue, EBITDA and EPS deviations" across 1026 models stood at 9.5%, 14.75% and 20.31% respectively, almost similar with our numbers in the past years. For Nifty 200, i.e. top 200 constituents these numbers stood at 7.30%/10.77%/16.35% indicating that our numbers were broadly inline.
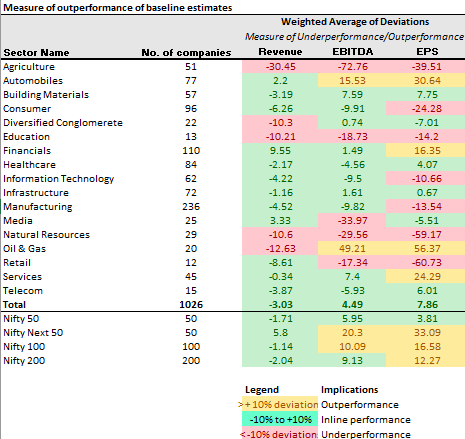
- The conservative bias that we had in our estimates in the previous few cycles was noticeably lower this time around. Our team focused on maintaining the estimates broadly inline with the company's actual performance trend through the quarters. Additionally, as there were no major macro surprises the deviations were lower this time except the sector - Agriculture (Fertilizers and Pesticides) where Revenue and Margins have shown a huge dip largely due to the channel destocking, pricing pressure and high cost inventory liquidation.
- Accurate areas – IT services, Financials, Building Materials and Automobiles. Our models for several large cap companies such as HDFC Bank, TCS, HCL Tech, Bajaj Auto, Mahindra & mahindra Ltd, Bosch, Persistent Systems etc. had less than 5% deviation across Revenue/EBITDA/EPS.
- Inaccurate areas - Our model numbers were off in Manufacturing, Diversified Conglomerate, and Agriculture. Companies where our models were off significantly were Adani Enterprises Ltd, Godrej Industries, , ICICI Prudential Life Insurance, Khadim India, Bata India, all Fertilizers and Pesticides companies' ( eg - UPL Ltd, Deepak Frertilizers, National Fertilizers, coromandel International Ltd ...) etc.
- At overall topline level - Out of total 17 sectors, our models were broadly inline in 10 sectors including IT services, Consumers, Building Materials, Healthcare, Financials, Automobiles, Natural Resources and Services etc. While for Diversified Conglomerate, Agriculture and Infrastructure, we were significantly behind actuals.
We measure the quality of our models on a few parameters mainly being:
- The deviation that a base model has with the actual reported number at the end of the year on Revenue and EBITDA. We aim to keep this value within a range of +/- 10%.
- The models should as much as possible reflect a true operational model of the company.
Do note that our models are typically updated at the start of the year and are basically to help investors project their own views of the companies they are looking at. Do let me know if you would like to have a closer look at the data. Below are the results:-
To check company-wise detailed analysis, please visit on our page 'Model Variances'.
Related Blogs

FINANCIAL MODELS AND THEIR NUANCES (PART 1)
Financial models are tools used by analysts to est....
Udit Garg
13/01/2017 12:00 AM

FINANCIAL MODELS AND THEIR NUANCES (PART 2)
Continuing from our previous post on Financial mod....
Udit Garg
13/01/2017 12:00 AM